


How to Trade the Double Bottom Pattern Step by Step in 2026
Few chart setups have stood the test of time like the double bottom pattern. I first traded one on a stock chart years ago, long before algorithms ran most of the order flow. Markets have changed a lot since then. However, this simple "W" shape still shows up on stocks, forex, crypto, and commodities every single week.
In this guide, you will learn what the pattern is and why it works. You will also learn how to trade it, step by step. Along the way, we will cover entries, stop losses, the double bottom pattern target price, and the most common mistakes. Finally, we will compare the double bottom vs triple bottom so you can tell them apart with confidence.
What Is a Double Bottom Pattern?
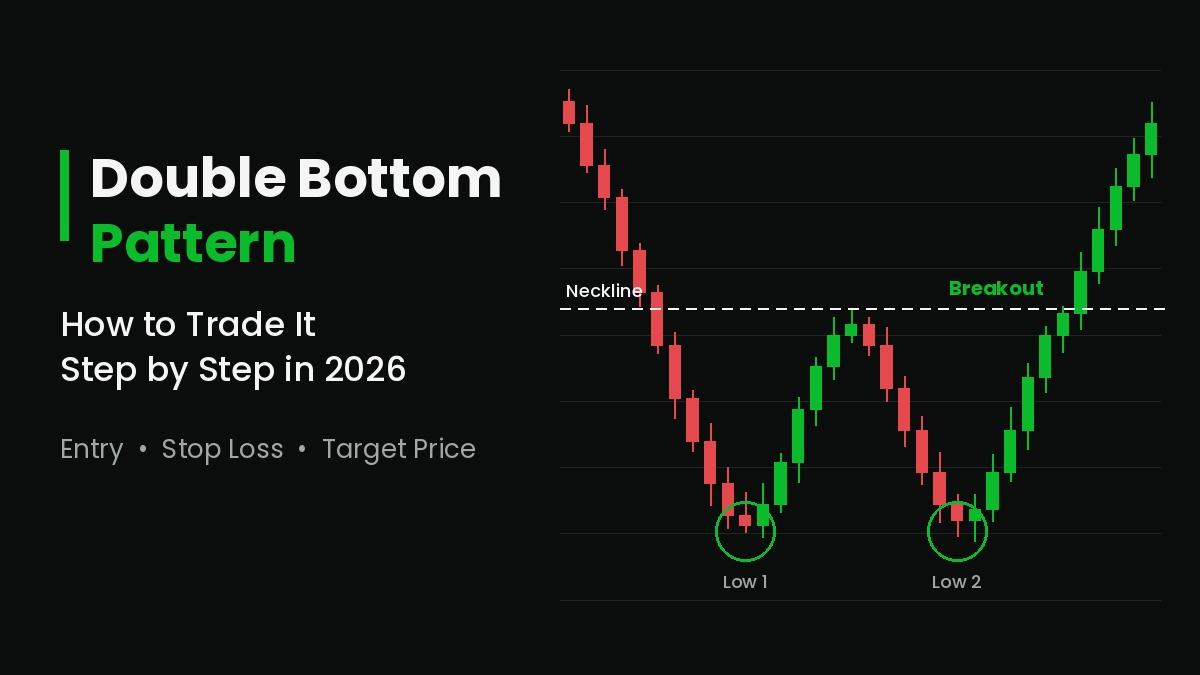
A double bottom pattern is a bullish reversal formation. It appears after a downtrend and signals that sellers may be running out of steam. On a chart, it looks like the letter "W."
The structure has four parts:
- A prior downtrend. Price must be falling before the pattern forms.
- The first low. Sellers push price down to a support level, and buyers step in.
- The neckline. Price bounces to a peak, which becomes the key resistance level.
- The second low. Price falls again but holds near the first low before turning up.
The pattern only completes when price closes above the neckline. Until then, it is just a possibility. This is the single most important rule to remember.
Why the Double Bottom Pattern Works
Every chart pattern tells a story about buyers and sellers. In this case, the story is about failure. Sellers drive price lower and hit a floor. They try again a few weeks later, yet they cannot break through.
That second failed attempt matters. It shows that demand is strong at that price. Meanwhile, short sellers start to cover their positions, and new buyers notice the support. As a result, buying pressure builds. When price finally clears the neckline, trapped sellers rush to exit, which often fuels a sharp move higher.
In other words, the double bottom pattern reflects a shift in control. Sellers had it during the downtrend. Buyers take it back at the breakout.
How to Trade the Double Bottom Pattern Step by Step
Over the years, I have refined my approach into six clear steps. Follow them in order, and do not skip ahead.
Step 1: Confirm the Prior Downtrend
First, look for a clear decline before the pattern. A "W" shape in a sideways range is not a reversal signal, because there is nothing to reverse. Ideally, price should have made a series of lower highs and lower lows. A drop of at least 10% to 20% on daily charts gives the setup more meaning.
Step 2: Identify Two Similar Lows
Next, find two lows at roughly the same level. They do not need to match perfectly. In practice, most traders accept lows within 3% to 4% of each other. A second low that sits slightly higher than the first is often a stronger sign, since it shows buyers stepping in earlier.
Time between the lows also matters. On a daily chart, a gap of two to eight weeks is common. If the lows form only a few candles apart, the signal is weaker and easily fails.
Step 3: Draw the Neckline
Now, mark the highest point between the two lows. Then draw a horizontal line across it. This is your neckline, and it acts as resistance until price breaks through.
On some charts, the peak may be uneven. In that case, use the highest candle close rather than the wick. This keeps your level clean and reduces false signals.
Step 4: Wait for a Confirmed Breakout
This is where patience pays off. Many traders buy at the second low and hope. That approach can work, but it carries far more risk. Instead, wait for a candle to close above the neckline.
Volume adds extra confirmation. A strong breakout usually comes with rising volume. In contrast, a breakout on thin volume deserves caution.
You then have two entry options:
- Breakout entry. Buy as soon as a candle closes above the neckline. You catch the move early, but false breakouts can hurt.
- Retest entry. Wait for price to pull back and test the neckline as new support. This entry is more conservative. However, strong moves sometimes never retest, so you may miss the trade.
Personally, I prefer the retest entry on volatile assets like crypto. On steadier markets, the breakout entry often works well.
Step 5: Place Your Stop Loss
Every trade needs a defined exit for when you are wrong. For this setup, place your stop loss just below the second low. That level is the logical point where the pattern fails.
Some traders use a tighter stop just below the neckline after a retest entry. This improves the risk-to-reward ratio. On the other hand, it increases the chance of being stopped out by normal noise. Choose based on the asset's volatility and your own risk tolerance.
As a general rule, risk no more than 1% to 2% of your account on a single trade. Position size should come from your stop distance, not from a gut feeling.
Step 6: Calculate the Double Bottom Pattern Target Price
The final step is setting a profit target. The classic method is simple. Measure the distance from the lowest low to the neckline. Then add that distance to the neckline.
Here is a quick example. Suppose the lows sit at $50 and the neckline sits at $60. The pattern height is $10. Therefore, the double bottom pattern target price would be $70.
This measured-move target is a guide, not a promise. In my experience, price reaches the full target in many cases but not all of them. For that reason, many traders take partial profits halfway to the target. They then move their stop to breakeven and let the rest run.
It also helps to check for resistance zones before you commit. If a major resistance level sits below your target, adjust the double bottom pattern target price to that level instead.
A Practical Trade Example
Let us walk through a simple trade from start to finish. Imagine a stock falls from $80 to $50 over three months. It bounces to $58, then slides back to $51 four weeks later. So far, you have a downtrend, two similar lows, and a neckline at $58.
Next, the stock closes at $59 on strong volume. That close confirms the double bottom pattern. You buy at $59 and place your stop at $49.50, just below the second low. Your risk is $9.50 per share.
The pattern height is $8, measured from the $50 low to the $58 neckline. As a result, your target sits at $66. You sell half the position at $62 and move your stop to $59. A week later, price touches $66, and you close the rest.
Notice what made this trade work. You did not guess the bottom. Instead, you let the chart prove itself first.
Common Mistakes to Avoid
Even experienced traders make errors with this setup. Here are the ones I see most often.
Entering before the breakout. A "W" that never breaks the neckline is just a range. Buying early turns a high-probability setup into a guess.
Ignoring the bigger trend. A double bottom on a 5-minute chart means little if the weekly trend points sharply down. Always check at least one higher timeframe.
Forcing the pattern. Not every pair of lows is a double bottom. If you need to squint to see it, it probably is not there.
Skipping the stop loss. Patterns fail. In fact, a failed double bottom pattern can lead to a fast drop as buyers give up. A stop loss protects you when that happens.
Ignoring volume. A breakout with weak volume often fades. Volume is not a perfect filter, but it improves your odds.
Double Bottom vs Triple Bottom
Traders often ask about the double bottom vs triple bottom debate. Both are bullish reversal patterns, and both form after a downtrend. The difference lies in how many times price tests support.
A double bottom tests support twice. A triple bottom tests it three times before breaking out. Because of this, a triple bottom usually takes longer to form.
Some traders see the triple bottom as more reliable. After all, support held three times instead of two. On the other hand, it appears less often and can test your patience. Also, a third test sometimes signals that buyers are tiring, so you should still wait for the neckline break.
The trading rules are almost identical. You draw the neckline across the highest peak, wait for a close above it, and set a stop below the lows. The target price uses the same measured-move method. In short, when comparing double bottom vs triple bottom, focus less on the count of lows and more on the quality of the breakout.
Tips for Trading the Double Bottom Pattern in 2026
Markets in 2026 move faster than ever. Algorithmic trading and 24-hour crypto markets create more false breakouts than in the past. With that in mind, these habits will help:
- Use multiple timeframes. Spot the pattern on the daily chart, then refine your entry on the 4-hour chart.
- Add an indicator for confirmation. A bullish RSI divergence at the second low is a strong supporting signal. Likewise, a MACD crossover near the breakout adds weight.
- Watch major news events. Interest rate decisions and earnings reports can break any pattern. Avoid entering right before them.
- Backtest before going live. Review at least 30 past examples on your chosen market. This shows you how the pattern behaves in that specific asset.
- Keep a trading journal. Record every double bottom pattern trade, including the setup, entry, exit, and result. Over time, your notes will reveal what works for you.
Final Thoughts
The double bottom pattern remains one of the most practical tools in technical analysis. It is easy to spot, yet it rewards traders who wait for confirmation. To recap, confirm the downtrend, find two similar lows, draw the neckline, and wait for the breakout. Then protect yourself with a stop loss and plan your exit with a measured target.
No pattern wins every time, so treat each trade as one of many. Discipline and risk management will matter far more than any single setup. If you want help spotting chart signals faster, some traders combine manual analysis with indicator tools such as GainzAlgo. Before adding any tool to your process, it is wise to do your own research and ask questions like "is gainzalgo legit" by reading independent reviews and testing it on a demo account first.

 Arabic
 French
 Spanish
 Portuguese
 Deutsch
 Turkish
 Dutch
Dutch
 Italiano
 Russian
 Romaian
 Portuguese (Brazil)
 Greek
Greek