


How Financial Ratios Reveal a Company's Creditworthiness Before You Extend Credit
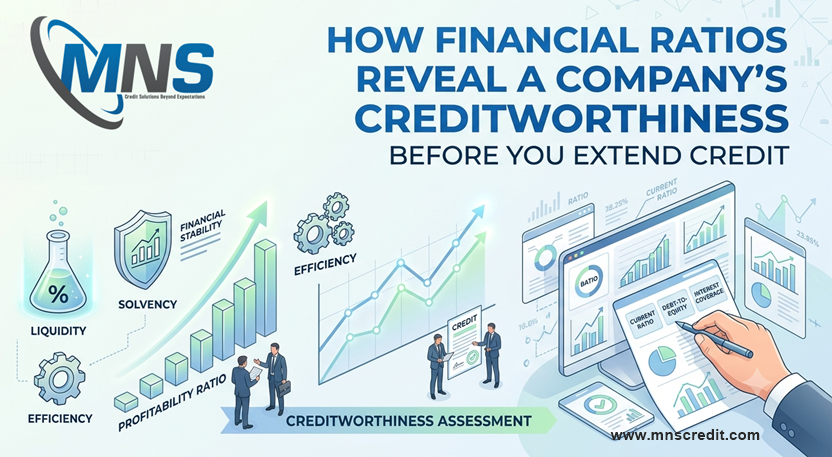
Extending credit to a new customer or business partner is, at its core, a bet on their ability to pay you back on time. Sales teams often push for faster approvals to close deals, but every unpaid invoice that turns into a bad debt eats directly into margins that took months to build. Before a single rupee of credit is sanctioned, finance and risk teams need a reliable, repeatable way to test whether a counterparty can actually honour its obligations. Financial ratio analysis remains one of the fastest and most defensible ways to do this, because it converts raw financial statements into standardised signals that can be compared across companies, sectors, and time periods.
Ratios alone are not a substitute for full due diligence, but they are the first filter that tells you whether a deeper investigation is warranted. This article walks through the ratio categories that matter most when assessing creditworthiness, what each one is really telling you, and how to read them together rather than in isolation.
Why Ratio Analysis Sits at the Centre of Credit Decisions
A balance sheet and profit and loss statement, read in isolation, tell you what happened to one company in one year. Ratios strip out the effect of company size and let you compare a small distributor against a large manufacturer, or this year's numbers against last year's, on a level footing. For credit managers, that comparability is exactly what is needed to set credit limits, decide payment terms, and flag accounts that need closer monitoring.
A structured credit assessment report typically builds its risk score around exactly these ratio families, layered with qualitative checks on litigation history, statutory filings, and promoter background.
Liquidity Ratios: Can They Pay in the Short Term?
Liquidity ratios answer the most immediate question a creditor has: does this company have enough short-term assets to cover what it owes in the next twelve months?
● Current Ratio (Current Assets ÷ Current Liabilities): A ratio below 1 means liabilities exceed assets due within a year, a clear warning sign. A ratio between 1.3 and 2 is generally considered healthy, though the right benchmark varies by industry.
● Quick Ratio (Current Assets minus Inventory, divided by Current Liabilities): This removes inventory, which can be slow to convert to cash, giving a more conservative view of near-term solvency.
● Cash Ratio (Cash and Equivalents ÷ Current Liabilities): The strictest liquidity test, showing what the company could pay immediately without selling any assets or collecting any receivables.
A company with a declining current ratio over two or three consecutive years is often masking working capital stress, even if its revenue is still growing. This trend matters more than any single year's snapshot.
Leverage and Solvency Ratios: How Much Debt Are They Carrying?
A company can be profitable and still be a poor credit risk if it is carrying more debt than its cash flows can service. Leverage ratios reveal how much of the business is funded by borrowed money and how exposed it is if revenue slows down.
● Debt-to-Equity Ratio (Total Debt ÷ Shareholders' Equity): A high ratio signals the company relies heavily on external financing, which increases the risk that lenders and secured creditors get paid before you do in a downturn.
● Interest Coverage Ratio (EBIT ÷ Interest Expense): This shows how comfortably operating earnings cover interest obligations. A ratio under 1.5 is generally a red flag, indicating the company is close to being unable to service its debt from operations alone.
● Debt-to-EBITDA: Widely used by lenders to gauge how many years of earnings it would take to pay off total debt; anything above 4 to 5 times warrants scrutiny in most sectors.
High leverage is not automatically disqualifying; capital-intensive sectors like infrastructure or manufacturing routinely carry more debt than services businesses. What matters is whether the debt load is appropriate for the industry and whether coverage ratios show a comfortable buffer.
Profitability Ratios: Is the Business Fundamentally Sound?
Profitability ratios matter for credit decisions because a business that cannot generate margins will eventually struggle to fund working capital, service debt, or absorb a bad quarter.
● Net Profit Margin (Net Profit ÷ Revenue): Shows how much of every rupee of sales converts to bottom-line profit, after all expenses, interest, and taxes.
● Return on Assets, ROA (Net Profit ÷ Total Assets): Indicates how efficiently the company uses its asset base to generate earnings.
● Return on Capital Employed, ROCE (EBIT ÷ Capital Employed): A favourite among lenders because it reflects both profitability and how efficiently capital, including debt, is being deployed.
A sudden drop in margins, even with rising revenue, is a pattern worth investigating. It can indicate pricing pressure, rising input costs, or aggressive discounting to maintain sales volumes, all of which erode the buffer available to absorb payment delays to you.
Efficiency Ratios: How Well Do They Manage Working Capital?
Efficiency ratios reveal how disciplined a company is about converting sales into cash, which directly affects how promptly they can pay their own suppliers, including you.
● Accounts Receivable Turnover: Measures how quickly the company collects money owed to it. A declining turnover ratio suggests customers are taking longer to pay, which can eventually delay payments down the chain.
● Inventory Turnover: Low turnover can indicate slow-moving stock tying up cash that would otherwise be available to pay creditors.
● Accounts Payable Turnover and Days Payable Outstanding: A sharp increase in days payable outstanding, especially alongside strong reported profits, often signals the company is stretching its own suppliers to manage a cash crunch, a pattern many creditors miss until it is too late.
The Cash Conversion Cycle, which combines receivable days, inventory days, and payable days, is one of the most useful single numbers for judging how tightly a company manages its cash. A lengthening cycle over successive quarters is an early warning sign that predates most public news of financial trouble.
Reading Ratios Together, Not in Isolation
No single ratio tells the full story. A company can show a strong current ratio while its interest coverage is deteriorating, or healthy margins while its receivable days are stretching out. Credit analysts typically build a composite view by tracking five to seven ratios across three to five years, comparing the trend against industry peers rather than against an arbitrary universal benchmark. Sector context matters enormously; a current ratio that looks weak for a manufacturer might be entirely normal for a retail business with fast inventory turns.
It also helps to cross-check ratios against independent data sources rather than relying solely on figures the company itself has shared. Verifying reported financials against statutory filings and MCA data helps confirm that the numbers used in your ratio analysis reflect what has actually been filed with regulators, rather than a more favourable version presented during a sales pitch.
Where Ratio Analysis Falls Short
Financial ratios are backward-looking; they are built from historical statements that may be six to eighteen months old by the time you see them, especially for private companies with no obligation to publish quarterly results. Ratios also cannot capture qualitative risks such as pending litigation, promoter integrity issues, undisclosed related-party transactions, or sudden management changes. This is why experienced credit teams pair ratio analysis with third-party due diligence that verifies legal standing, ownership structure, and compliance history alongside the numbers.
Financial statements can also be manipulated or presented selectively, particularly by companies that know they are being evaluated for a credit line. Ratios calculated from unaudited or self-reported figures should always be treated with more caution than those drawn from audited statements or independently verified filings.
Building a Practical Credit Screening Process
A workable process for most businesses looks like this: pull at least three years of financial statements, calculate the core liquidity, leverage, profitability, and efficiency ratios, plot the trend rather than a single year's snapshot, benchmark against two or three direct competitors, and flag any ratio moving sharply in the wrong direction for further investigation. Combine this with a check of statutory filings, any history of delayed payments reported by other creditors, and litigation or default records before finalising a credit limit and payment term.
Set internal thresholds in advance, for example a minimum current ratio, a maximum debt-to-equity level, and a minimum interest coverage ratio, so that credit approvals are consistent and defensible rather than driven case by case by relationship pressure from the sales team.
Conclusion
Financial ratios turn a company's financial statements into a structured, comparable signal of credit risk, and they remain the fastest way to separate genuinely creditworthy counterparties from those carrying hidden stress. Used alone, they leave gaps that only independent verification and qualitative due diligence can close. Used as part of a disciplined screening process, backed by verified data and updated regularly, they give credit and risk teams the confidence to extend credit on terms that protect the business while still supporting growth.

 English
 Arabic
 French
 Spanish
 Portuguese
 Deutsch
 Dutch
Dutch
 Italiano
 Russian
 Romaian
 Portuguese (Brazil)
 Greek
Greek