


Understanding Vehicle Movement and Traffic Flow in the UAE with Traffic Surveys
Ask ten people why a particular road feels congested and most will point to vague impressions rather than evidence. Professional Traffic Surveys replace that guesswork with hard numbers, measuring exactly how many vehicles, pedestrians, and cyclists move through a corridor, at what speed, and in which direction, so planners can diagnose the real cause of a flow problem rather than its symptoms. Traffic flow is a genuinely technical subject with its own vocabulary and relationships between variables, yet it directly shapes everyday experience on UAE roads — why a journey takes fifteen minutes on one Tuesday and forty on the next.
This article breaks down what traffic flow actually means, which data collection methods reveal which part of the picture, and how to read the resulting numbers correctly so they lead to the right design decision rather than the wrong one.
Understanding these fundamentals is useful whether you are a planner commissioning a study, a developer reviewing a consultant's report, or simply someone who wants to understand why a familiar road behaves the way it does.
What "Traffic Flow" Actually Means
In traffic engineering terms, flow describes the rate at which vehicles pass a given point, usually expressed in vehicles per hour, and it is fundamentally different from simply counting how many cars are visible on a road at any one moment.
A road can look busy because many vehicles are present but moving slowly, or because fewer vehicles are passing quickly — two very different conditions that feel similar to a driver but require entirely different engineering responses.
The Three Variables Every Flow Study Measures: Volume, Speed, and Density
Flow, speed, and density are mathematically linked: flow equals density multiplied by speed, meaning any two of these variables, once measured, allow the third to be calculated rather than guessed.
As density rises on a given stretch of road, speed typically falls, and beyond a certain point flow itself starts to decrease even though more vehicles are physically present — the defining signature of genuine congestion rather than simply busy conditions.
Why Professional Traffic Surveys Are the Starting Point for Understanding Flow
None of these relationships can be understood from intuition alone, which is why properly designed Traffic Surveys sit at the foundation of any serious attempt to diagnose or improve traffic flow on a UAE corridor.
A survey program should be scoped around the specific flow question being asked — is this about peak-hour capacity, directional imbalance, pedestrian conflict, or seasonal variation — rather than defaulting to a generic one-size-fits-all count.
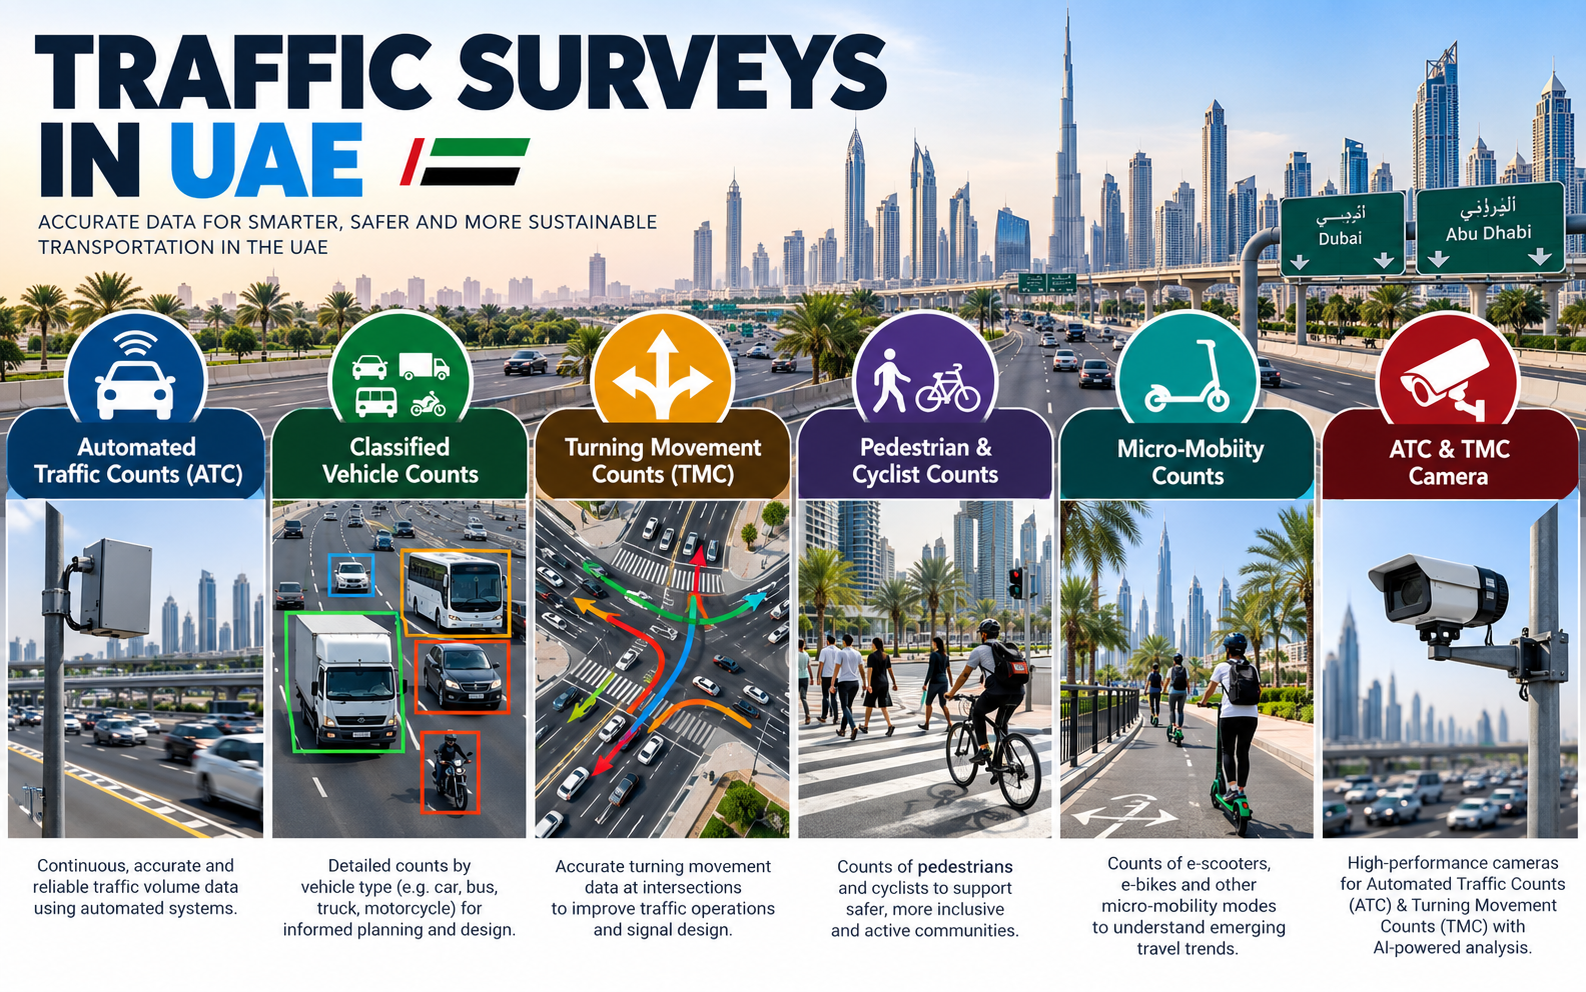
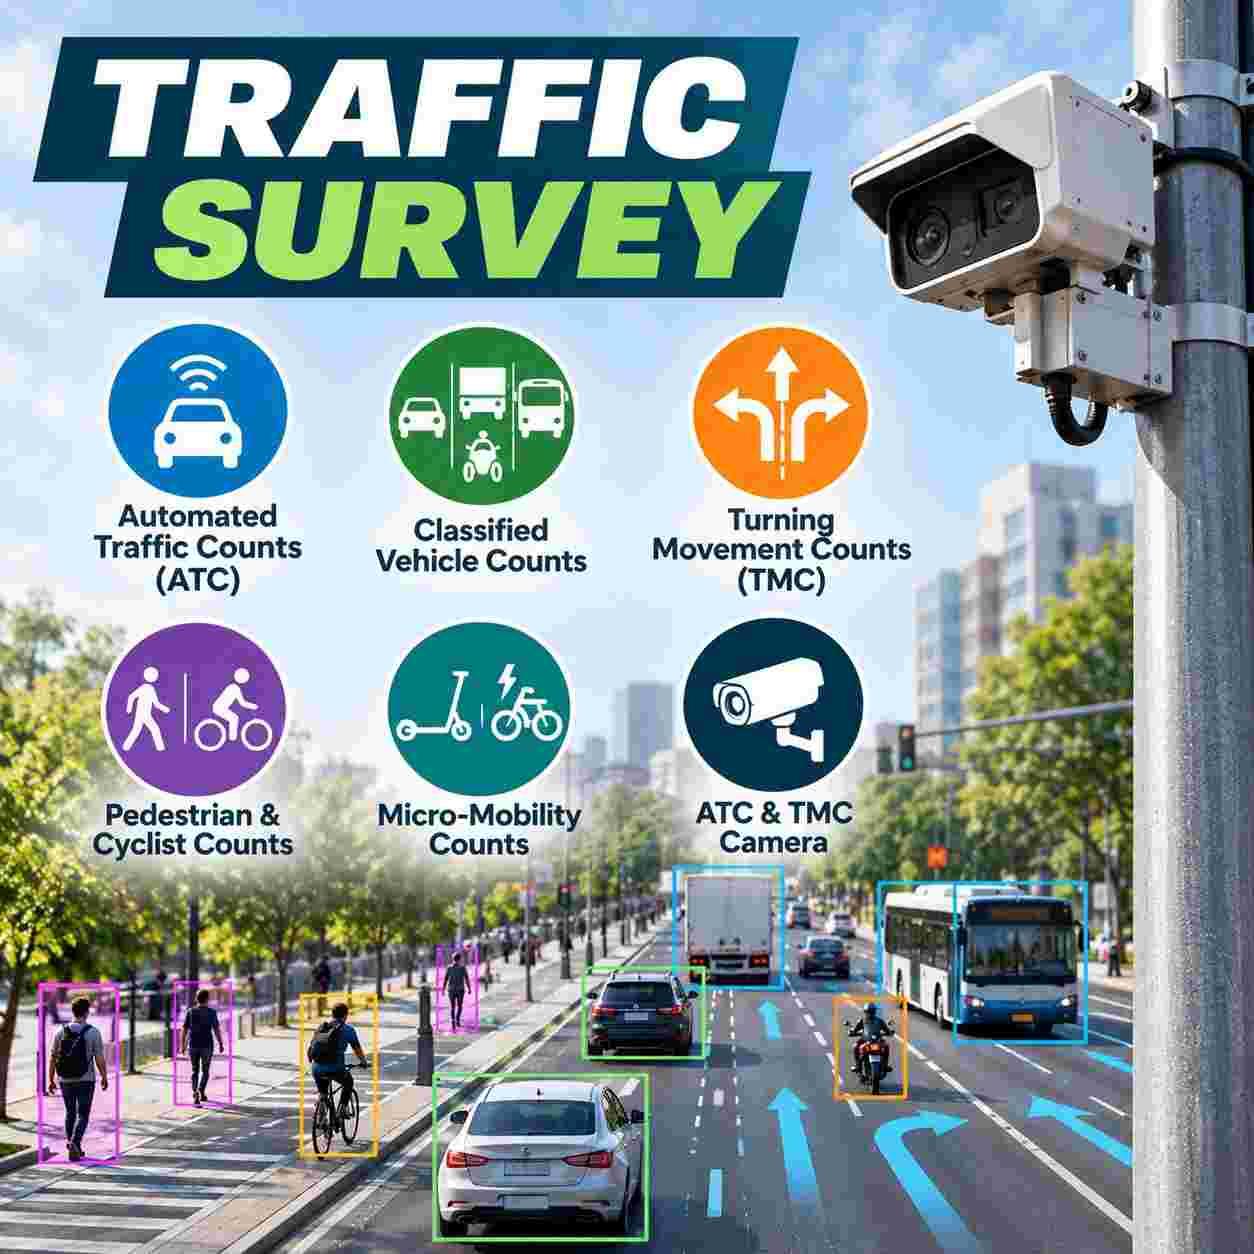
Measuring Volume Continuously with Automated Traffic Counts (ATC)
Automated Traffic Counts (ATC) provide the continuous volume data needed to calculate flow accurately across different times of day, days of the week, and seasons, revealing exactly when and how severely a corridor approaches its practical capacity.
Because flow and capacity both vary throughout the day, a single snapshot count can easily miss the actual peak period, while continuous ATC data captures the true highest-demand hour rather than an assumed or estimated one.
Understanding Composition Through Classified Vehicle Counts
Not all vehicles affect flow equally. Classified Vehicle Counts reveal the mix of cars, buses, and heavy goods vehicles passing a point, data that matters because a single truck can occupy as much road space and affect flow as much as two or three passenger cars.
Traffic engineers apply passenger car equivalent factors to account for this difference, meaning accurate vehicle classification is essential to converting a raw count into a genuinely meaningful flow and capacity analysis.
Decoding Junction Behaviour with Turning Movement Counts (TMC)
Flow at a junction behaves very differently from flow along an open road segment, and Turning Movement Counts (TMC) are what reveal exactly how demand splits by direction, the key input for calculating how much green signal time each approach genuinely needs.
A junction can show perfectly adequate total flow on paper while still suffering from severe congestion on one specific approach, a pattern that only becomes visible once movement is broken down by direction rather than viewed as an aggregate total.
Flow Isn't Just Vehicles: Pedestrian & Cyclist Counts
Traffic flow analysis that only considers vehicles misses a significant part of the picture in many UAE districts, which is why Pedestrian & Cyclist Counts are increasingly treated as a core input rather than an optional add-on to a flow study.
Pedestrian crossing demand at a signalized junction directly affects vehicle flow by competing for the same green time, meaning a flow analysis that ignores foot traffic can significantly misjudge how much vehicle capacity a junction genuinely has available.
The Newest Variable in UAE Flow Patterns: Micro-Mobility counts
E-scooters and e-bikes have introduced a genuinely new flow dynamic on many UAE streets, and Micro-Mobility counts are necessary to understand how this category interacts with both vehicle and pedestrian flow at shared conflict points.
Because these devices often move at speeds between walking pace and vehicle speed, they create a distinct flow category that older traffic models were never designed to account for, making dedicated counts essential rather than optional.
Capturing Multi-Dimensional Flow Data with ATC & TMC Camera Technology
Combined ATC & TMC Camera systems allow analysts to observe volume, classification, turning movement, and pedestrian or cyclist activity simultaneously from the same video record, giving a genuinely multi-dimensional view of flow rather than several disconnected single-variable counts.
This integrated view is particularly valuable for diagnosing complex congestion, where vehicle flow, pedestrian crossing demand, and turning movement restrictions may all be interacting at the same location simultaneously.
What Causes Congestion? Reading the Data Correctly
Congestion is not simply "too many cars" — it is the specific point where density has risen high enough that flow itself begins falling, and recognizing that threshold in the data is what separates a genuinely useful diagnosis from a superficial one.
A bottleneck upstream of an observation point can also make a downstream location appear to have light traffic simply because demand never reaches it at full volume, which is why survey locations need to be chosen carefully relative to known pinch points.
Peak Hour Factor and Level of Service Explained
The peak hour factor describes how evenly traffic is distributed within the busiest hour, since a sharp fifteen-minute surge creates a very different operational experience than the same total hourly volume spread evenly across sixty minutes.
Level of service grades, familiar to most transport engineers, translate measured flow and density conditions into an easily communicated letter grade, giving non-technical stakeholders a quick way to understand survey findings without needing to interpret raw flow equations directly.
Applying Flow Data: Traffic Surveys UAE in Practice
Consultants delivering Traffic Surveys UAE work translate raw flow, speed, and density figures into the specific design recommendations a project needs, whether that means additional lanes, revised signal timing, or a fundamentally different junction layout.
Presenting this analysis in the format expected by the Roads and Transport Authority or the Department of Municipalities and Transport also matters, since a technically correct flow analysis still needs to be communicated in a way regulator can efficiently review and approve.
Dubai's Unique Flow Patterns: Traffic Surveys Dubai
Traffic Surveys Dubai work regularly uncovers flow patterns shaped by the emirate's specific mix of commuter corridors, tourism-driven destinations, and major event traffic, patterns that a generic regional flow model would likely miss entirely.
A corridor serving both daily commuters and weekend leisure traffic, for example, can show two genuinely different flow profiles depending on the day, making single-day surveys considerably less reliable than a properly scoped multi-day program.
Common Misreading of Traffic Flow Data
A frequent mistake is interpreting a high-volume count in isolation as evidence of congestion, when the more important signal is actually a drop-in flow and speed together, which indicates the road has genuinely reached its practical capacity.
Another common error is surveying only vehicle movement at a junction experiencing heavy pedestrian activity, producing a flow analysis that looks complete on paper but misses a major contributing factor to the congestion being investigated.
Finally, some studies rely on a single day's data to represent year-round conditions, when UAE traffic patterns can shift meaningfully between weekdays, weekends, school terms, and major public holidays.
Working with a Proven UAE Survey Partner
Consultants and developers looking to understand flow conditions on a specific corridor can review the professional traffic counting and survey services delivered by Top Precision Mobility LLC to see how a properly scoped count program can answer the specific flow question their project actually needs answered.
Turning Flow Data into Design Decisions
Flow data only has value once it is correctly interpreted and translated into a design recommendation a project team can act on. Engineers scoping a flow study often begin with a methodology discussion through Top Precision's mobility data specialists, who can recommend the specific count combination needed to diagnose a given corridor's behaviour accurately.
Conclusion
Understanding vehicle movement across the UAE starts with properly scoped Traffic Surveys that measure flow rather than guess at it. Continuous Automated Traffic Counts (ATC), detailed Classified Vehicle Counts, and precise Turning Movement Counts (TMC) reveal exactly where and why a corridor is congested. Comprehensive Pedestrian & Cyclist Counts and emerging Micro-Mobility counts, captured through modern ATC & TMC Camera technology, complete the full flow picture. For Traffic Surveys UAE compliance, or a Traffic Surveys Dubai corridor study specifically, Top Precision Mobility LLC turns raw numbers into a correct, actionable diagnosis.
FAQs
1. How do Traffic Surveys help explain why a road feels congested?
They measure volume, speed, and density together rather than relying on impression, revealing whether a road has genuinely reached its practical capacity or simply appears busy without an actual flow breakdown.
2. Why is a single snapshot count less reliable than Automated Traffic Counts (ATC)?
A snapshot can easily miss the true peak period, while continuous ATC data captures the actual highest-demand hour across multiple days rather than an assumed or estimated one.
3. Why do Classified Vehicle Counts matter for calculating flow accurately?
A single heavy vehicle occupies as much road space and affects flow as much as two or three passenger cars, so classification data is essential for applying correct passenger car equivalent factors.
4. How do Turning Movement Counts (TMC) reveal hidden junction congestion?
They break demand down by direction, showing that a junction with adequate total flow on paper can still suffer severe congestion on one specific approach that an aggregate count would miss.
5. Why do Traffic Surveys Dubai often need to run across multiple days?
Corridors serving both daily commuters and weekend leisure traffic can show two genuinely different flow profiles depending on the day, making single-day data considerably less reliable than a multi-day program.

 English
 Arabic
 French
 Spanish
 Portuguese
 Deutsch
 Turkish
 Italiano
 Russian
 Romaian
 Portuguese (Brazil)
 Greek
Greek