


Best Forex Indicators for Day Trading: A Practical Guide for Smarter Trading
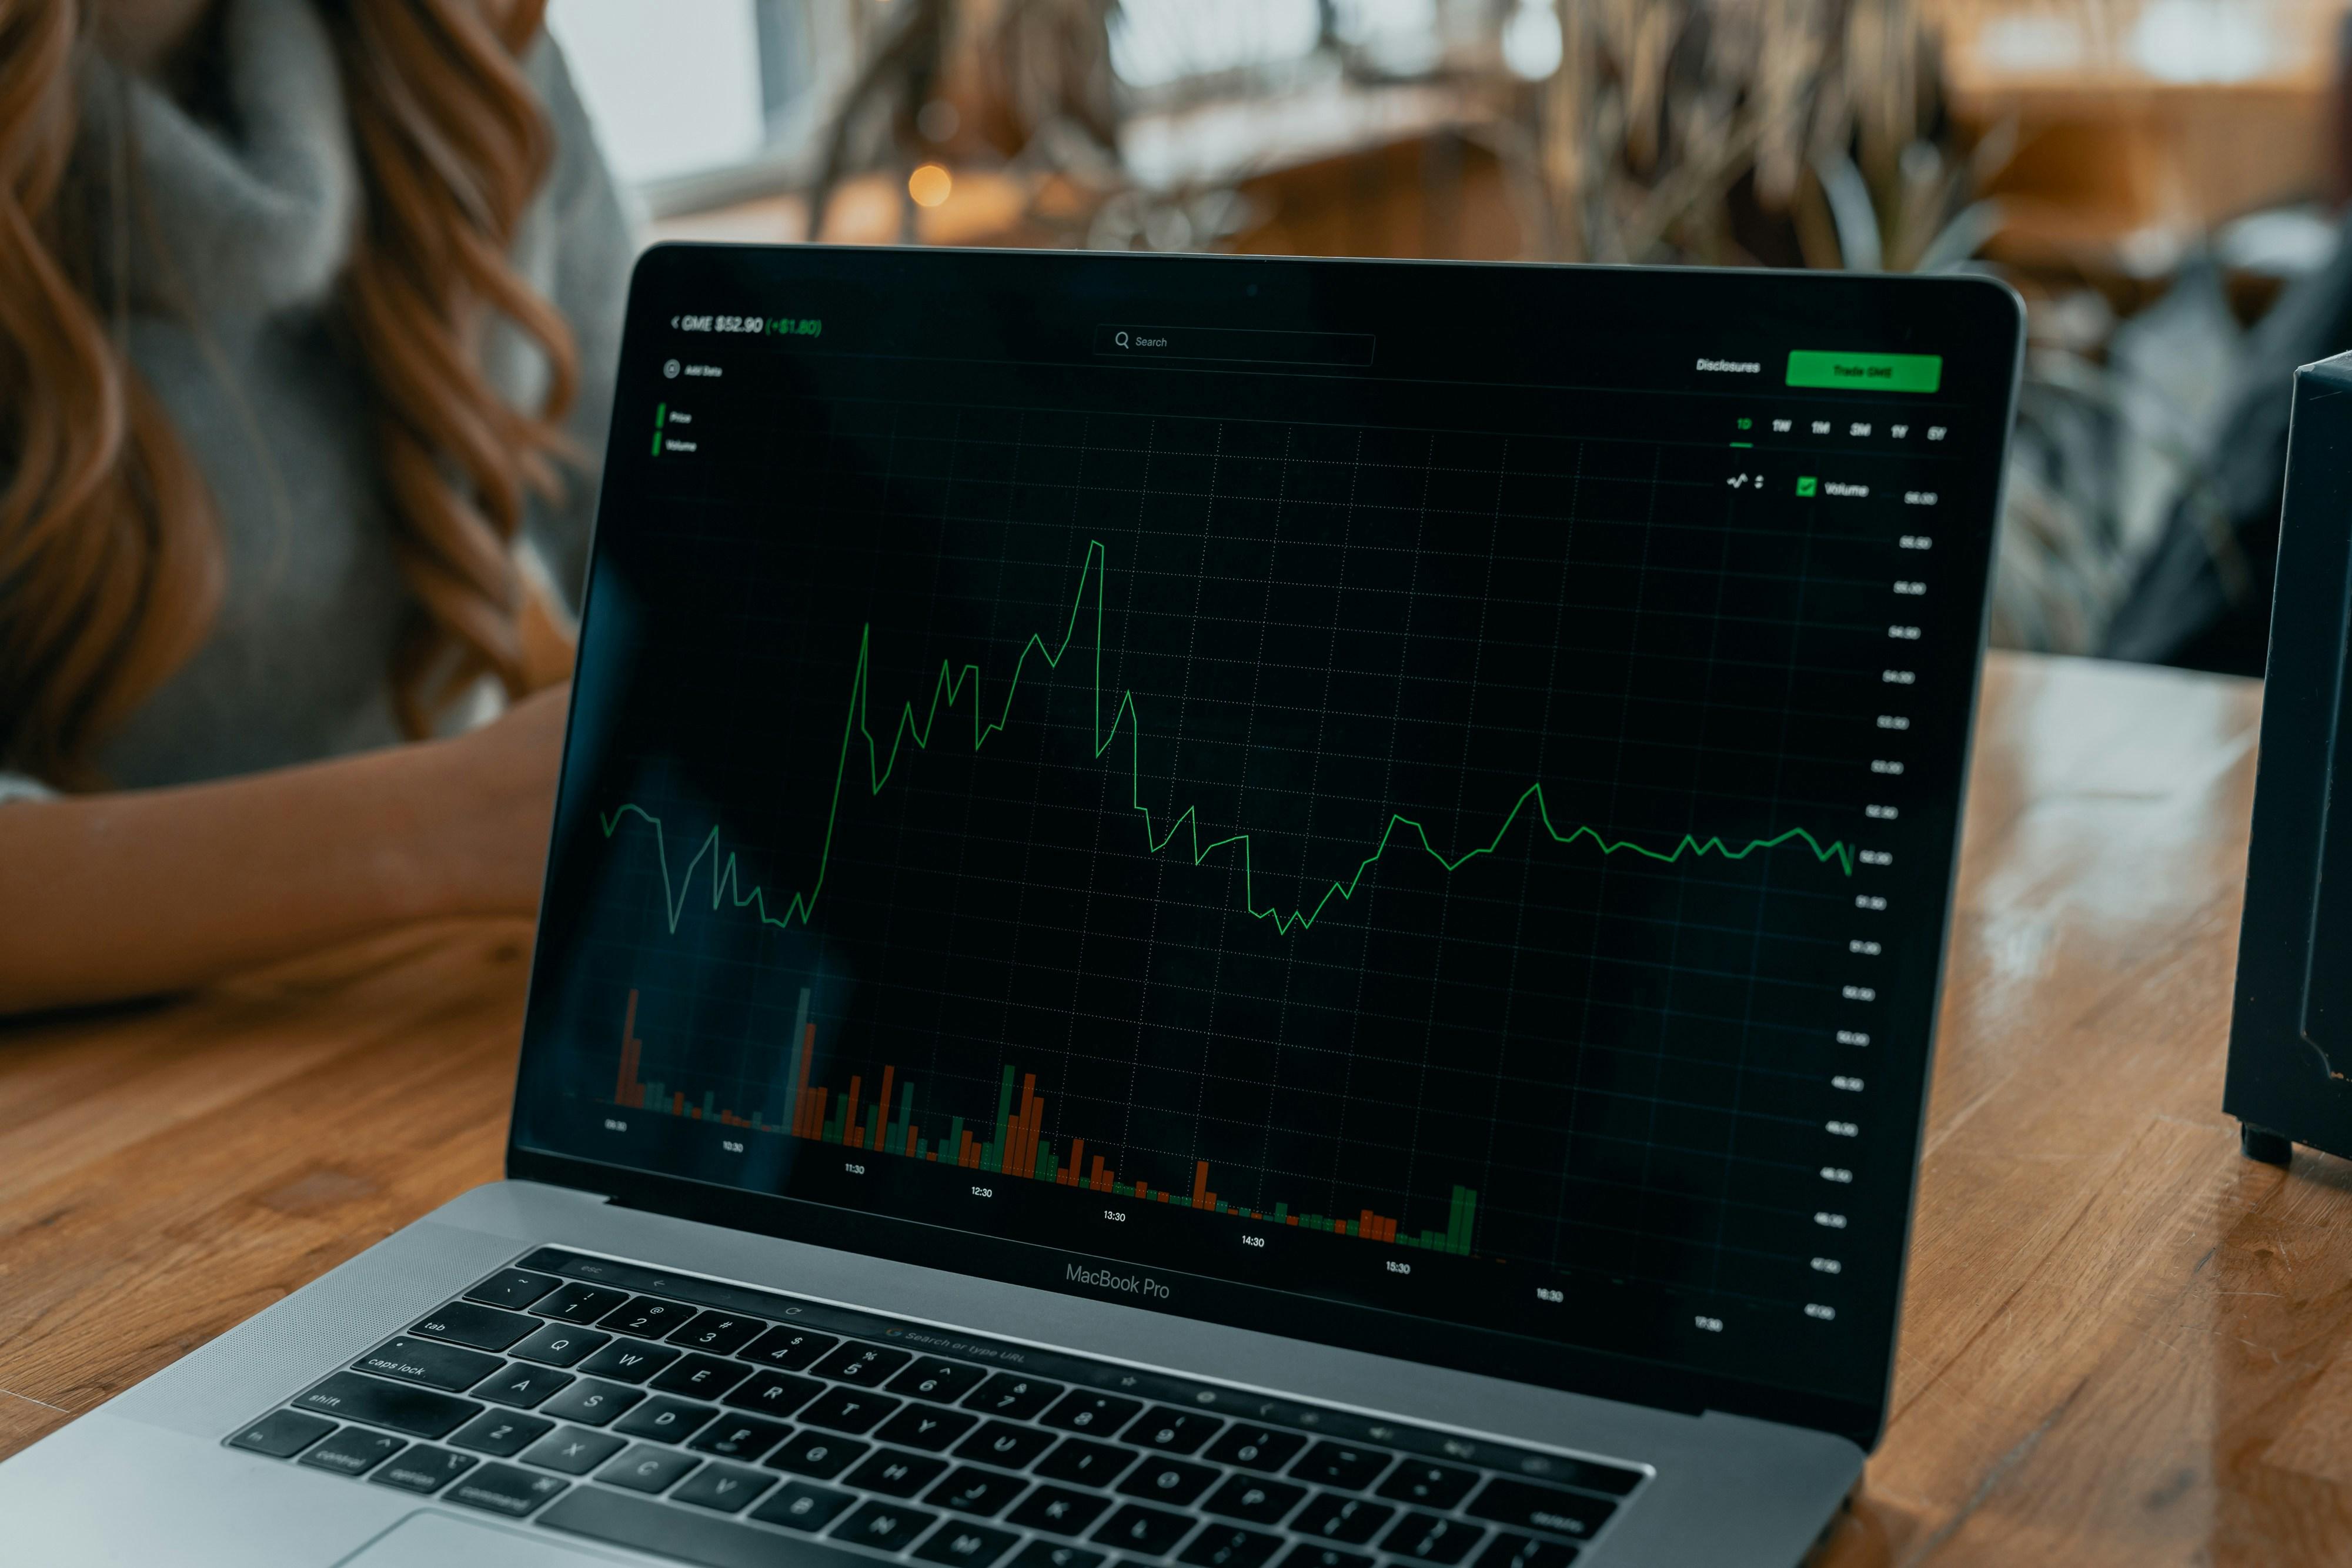
Day trading in the forex market can be exciting, but it also requires discipline, preparation, and a clear understanding of market movements. Unlike long-term investing, day trading focuses on short-term price changes, which means traders often need reliable tools to identify trends, momentum, potential entry points, and possible reversals.
Technical indicators can make this process easier by turning price and volume data into information that traders can analyze. However, using too many indicators at once can make a trading chart confusing rather than helpful. The goal should be to use a small selection of complementary tools and understand what each one is telling you.
For traders looking to improve their technical analysis, understanding the Best Forex Indicators for Day Trading can provide a useful starting point. Indicators such as the Relative Strength Index (RSI), Moving Averages, MACD, and Bollinger Bands are commonly used to evaluate short-term market conditions.
What Are Forex Trading Indicators?
Forex indicators are mathematical tools that analyze historical price data and, in some cases, volume or volatility. Traders use them to identify patterns and potential changes in market behavior.
Some indicators focus on trend direction, while others measure momentum, volatility, or possible overbought and oversold conditions. No single indicator can predict the future of a currency pair with certainty. Instead, indicators are best viewed as analytical tools that can support a broader trading plan.
For example, a moving average may help identify whether a market is generally trending upward or downward, while RSI can provide information about recent momentum. Combining these different types of information may give traders a more complete picture of market conditions.
Best Forex Indicators for Day Trading
There are many technical indicators available on modern trading platforms, but day traders generally benefit from tools that are relatively simple to interpret and can be applied to short-term charts.
1. Moving Averages
Moving averages are among the most widely used technical indicators in forex trading. They smooth out price fluctuations and help traders identify the broader direction of a market.
Two popular variations are the Simple Moving Average (SMA) and Exponential Moving Average (EMA). An EMA gives greater weight to recent prices, which can make it more responsive to short-term price changes.
Day traders may use moving averages to identify trends, dynamic support and resistance areas, or potential crossover signals. For instance, when a shorter-term moving average crosses above a longer-term average, some traders interpret it as evidence of increasing bullish momentum.
However, moving averages can produce misleading signals when the market is moving sideways. This is why traders often combine them with momentum or volatility indicators.
2. Relative Strength Index (RSI)
The Relative Strength Index, commonly known as RSI, is a momentum oscillator that measures the speed and magnitude of recent price movements.
RSI moves between 0 and 100. Traditionally, readings above 70 are associated with potentially overbought conditions, while readings below 30 are often considered potentially oversold.
For day traders, RSI can be useful when analyzing momentum and possible reversals. However, an important point is that an overbought market does not automatically mean that prices will fall. Similarly, an oversold reading does not guarantee that prices will rise.
In a strong trend, RSI can remain in an overbought or oversold area for an extended period. Traders should therefore consider the broader market trend and price action before making a decision based solely on RSI.

3. Moving Average Convergence Divergence (MACD)
MACD is another popular momentum and trend-following indicator. It compares two exponential moving averages and uses their difference to generate signals.
The MACD consists of the MACD line, signal line, and histogram. Traders commonly look for crossovers between the MACD and signal line, changes in histogram momentum, and divergences between price and the indicator.
For intraday forex trading, MACD can help traders understand whether momentum is strengthening or weakening. It can also complement moving averages because both tools provide information about trend and momentum from slightly different perspectives.
As with every indicator, MACD should not be treated as a standalone forecasting system. Market structure, support and resistance, and economic conditions can all affect the reliability of a signal.
4. Bollinger Bands
Bollinger Bands are designed to provide information about price volatility. The indicator typically consists of a middle moving average and two outer bands that adjust according to market volatility.
When volatility increases, the bands generally expand. When volatility decreases, they tend to contract.
This makes Bollinger Bands particularly interesting for traders watching changes in market volatility. A period of narrowing bands may indicate reduced volatility, while a subsequent expansion can accompany a significant price movement.
Traders sometimes use Bollinger Bands alongside price action to examine potential breakouts or reactions around the bands. However, touching an upper or lower band does not automatically mean that a reversal will occur.
5. Average True Range (ATR)
Average True Range, or ATR, is a volatility indicator rather than a directional indicator. It helps traders estimate how much a currency pair has been moving over a particular period.
This information can be valuable for day traders because volatility varies between currency pairs and trading sessions.
For example, a trader can use ATR when considering stop-loss placement or determining whether a potential price movement is large enough to justify a trade. The indicator does not tell traders whether to buy or sell; instead, it provides context about the market's typical price range.
How to Combine Forex Indicators Effectively
Using every available indicator on a chart is rarely a good idea. When several indicators provide similar information, traders may end up with multiple versions of the same signal.
A more practical approach is to combine indicators with different purposes.
For example:
-
A moving average can help identify the overall trend.
-
RSI can provide momentum information.
-
ATR can help assess volatility.
-
Price action can help identify potential entry and exit areas.
This combination gives traders different perspectives without unnecessarily overcrowding the chart.
A trader might first determine the market trend using a moving average, then examine RSI to understand momentum, and finally use price structure to identify a potential trade setup. The exact combination and settings should depend on the trader's strategy, timeframe, and risk tolerance.
For readers researching the Best Forex Indicators for Day Trading, this principle is important: the effectiveness of an indicator often depends less on having the "perfect" tool and more on understanding how to use it within a consistent trading framework.
Don't Ignore Price Action
Indicators are based on market data, so they should not completely replace the study of price itself.
Price action analysis involves observing candlestick patterns, swing highs and lows, support and resistance zones, breakouts, and changes in market structure.
For example, an RSI signal may appear attractive, but if the price is moving strongly in the opposite direction of the proposed trade, entering immediately may carry additional risk. Looking at the chart structure can provide context that an indicator alone cannot provide.
This is why many experienced traders use technical indicators as confirmation tools rather than as automatic buy or sell signals.
Risk Management Matters More Than Any Indicator
Even the most sophisticated technical indicator cannot eliminate trading risk. A solid risk-management plan should therefore be part of every day trading strategy.
Traders commonly consider factors such as position size, stop-loss placement, risk-to-reward ratio, and the amount of capital exposed to a single trade.
It is also important to avoid increasing position sizes simply because a previous trade resulted in a loss. Emotional decisions can quickly turn a manageable loss into a much larger one.
Before using a strategy with real money, traders may consider testing it on historical data or practicing in a demo environment. This can help reveal how the strategy behaves across different market conditions.
Common Mistakes When Using Forex Indicators
One of the biggest mistakes beginners make is assuming that an indicator can provide guaranteed signals. Financial markets are influenced by numerous factors, including economic releases, central-bank decisions, geopolitical developments, liquidity, and unexpected news.
Another common mistake is changing indicator settings repeatedly after a few unsuccessful trades. A strategy needs enough observations to determine whether its underlying logic is useful.
Overtrading is another issue. When traders place positions simply because an indicator has generated a signal, they may ignore whether the overall setup actually fits their trading plan.
Instead, traders should define their entry conditions, exit rules, risk limits, and preferred trading sessions before entering the market.

Choosing Indicators Based on Your Trading Style
The right technical indicators can vary depending on a trader's objectives.
A trend-focused trader may place greater emphasis on moving averages and MACD. Someone interested in momentum may pay closer attention to RSI. A trader who focuses on volatility may find ATR and Bollinger Bands particularly useful.
Timeframe also matters. An indicator can behave differently on a five-minute chart compared with a one-hour or daily chart.
There is no universal combination that works equally well for every trader or every currency pair. Instead, traders should evaluate indicators according to their strategy and test how they perform under different market conditions.
Resources such as Invest Intelligence Blog can also be useful for traders who want to continue learning about forex market analysis, technical tools, and trading concepts. The more familiar traders become with the strengths and limitations of each indicator, the easier it becomes to build a structured approach.
Final Thoughts
Technical indicators can be valuable additions to a forex day trading strategy, but they work best when used as part of a broader analytical process. Moving averages can help identify trends, RSI can provide momentum information, MACD can help evaluate trend and momentum changes, while Bollinger Bands and ATR can provide useful volatility insights.
The Best Forex Indicators for Day Trading are not necessarily the ones with the most complicated formulas or the greatest number of signals. A useful indicator is one that a trader understands and can apply consistently within a clearly defined strategy.
Rather than searching for a single indicator that predicts every market move, traders can focus on combining technical analysis, price action, risk management, and disciplined decision-making.
At Invest Intelligence Blog, the focus can remain on practical forex education that helps readers understand these tools without making unrealistic promises about trading results. Ultimately, indicators are tools—not guarantees—and responsible trading requires continuous learning, testing, and risk awareness.
For traders building their own approach, the key is to keep the chart understandable, use complementary indicators, and evaluate every setup within the context of the broader market.

 English
 Arabic
 Spanish
 Portuguese
 Deutsch
 Turkish
 Dutch
Dutch
 Italiano
 Russian
 Romaian
 Portuguese (Brazil)
 Greek
Greek