


Inside the SPARK Matrix™ for Infrastructure Monitoring & Observability: Trends, Vendors, and Buyer Insights
That scene is why Infrastructure Monitoring & Observability Platforms have moved from an engineering preference to a business resilience investment. When a minute of downtime can mean lost revenue and damaged trust, the ability to see inside your systems is a core capability. This article explains what these platforms do, the challenges and trends shaping the market, and how buyers can evaluate vendors using QKS Group's SPARK Matrix™ research.
Market Overview: One View Across the Entire Stack
According to QKS Group, an Infrastructure Monitoring and Observability Platform is a comprehensive software solution that provides real-time visibility, performance tracking, and deep diagnostic insights across an organization's entire IT infrastructure, spanning on-premises, cloud, and hybrid environments. It serves organizations of all sizes.
Most Infrastructure Monitoring & Observability Platforms include modules for:
• Metrics collection to track the health of servers, containers, networks, and services
• Log management to capture and analyze event data
• Distributed tracing to follow requests across services
• Alerting to notify teams when something needs attention
• Anomaly detection to surface unusual behavior early
• Dashboard visualization to turn telemetry into insight
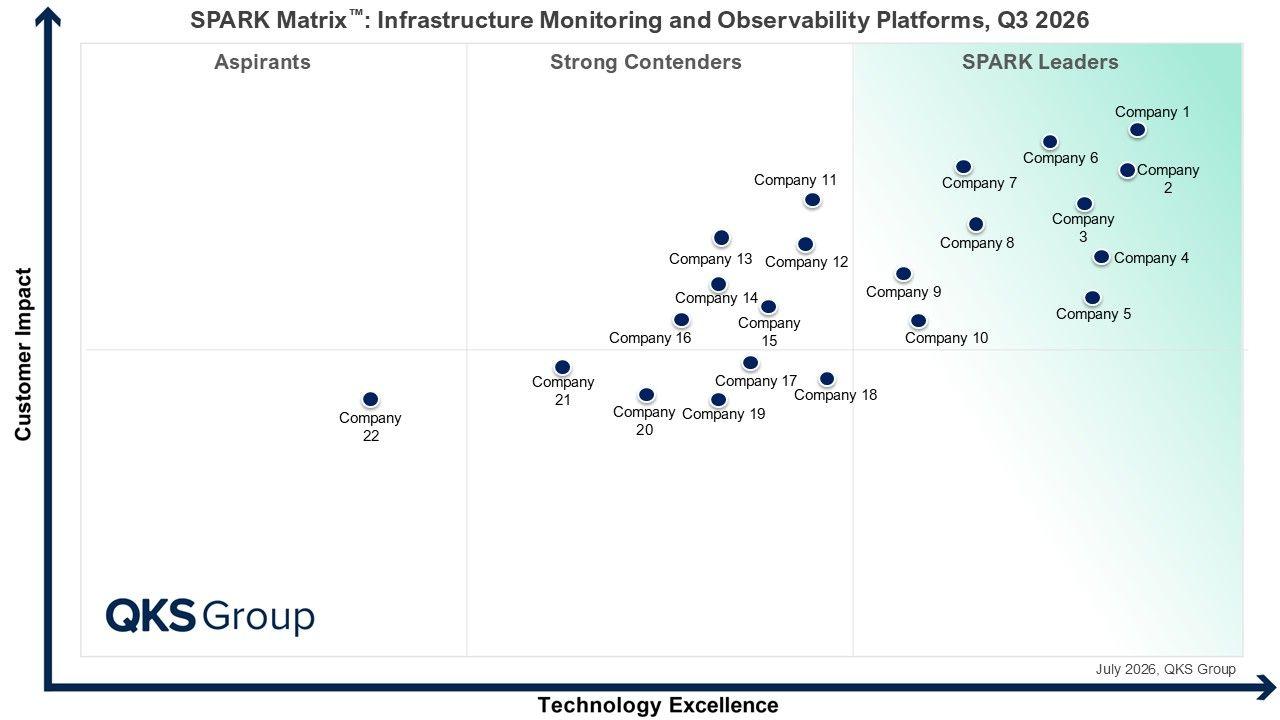
QKS Group's SPARK Matrix™ analysis includes vendors such as Amazon Web Services, Apica, BMC Software, Centreon, Chronosphere, Coralogix, Datadog, Dynatrace, Elastic, Grafana Labs, Honeycomb, IBM, ITRS, LogicMonitor, Microsoft, New Relic, Progress, Riverbed Technology, ScienceLogic, SolarWinds, Splunk, and Sumo Logic. They start from different places, such as application monitoring, log analytics, network monitoring, and open-source tooling, so structured comparison is essential.
Key Challenges Businesses Face
• Distributed environments. Applications span containers, multiple clouds, and legacy systems, and problems often hide between layers.
• Tool sprawl. Overlapping tools create fragmented data and slower incident response.
• Telemetry volume and cost. More services produce more data, and storing everything gets expensive.
• Alert noise. Too many alerts hide the ones that matter.
• Slow root cause analysis. Teams lose time switching between tools to connect metrics, logs, and traces.
• Rising reliability expectations. Customers and employees have little tolerance for degraded performance.
Key Trends and Innovations
Platform consolidation. Organizations want one place to correlate metrics, logs, traces, and events. Vendors are broadening platforms, while specialists compete on depth.
AI-driven operations. Machine learning for anomaly detection and event correlation is becoming a baseline expectation. Buyers should test whether AI measurably shortens time to resolution.
Open standards. Support for OpenTelemetry reduces instrumentation lock-in and gives teams more control over their data.
Cost and data management. Filtering, sampling, tiering, and routing telemetry intelligently is now a buying criterion.
Hybrid and multi-cloud coverage. Consistent visibility across on-premises, cloud, and hybrid environments is a major differentiator.
From IT metrics to business outcomes. Leading teams link infrastructure health to service-level objectives and customer experience.
Benefits and Business Impact
When implemented well, Infrastructure Monitoring & Observability Platforms help organizations proactively detect and resolve incidents, minimize downtime, optimize resource utilization, and ensure seamless application performance and reliability. In practice, that means:
• Faster incident response with correlated data in one place
• Less downtime through earlier detection of issues
• Better resource utilization by spotting waste and bottlenecks
• Lower tool and licensing overlap through consolidation
• Higher engineering productivity with less time spent firefighting
• Better customer experience through more reliable services
Use Cases and Real-World Examples
These are illustrative scenarios of typical applications:
• E-commerce. A retailer traces a slow checkout to a single overloaded service before customers notice.
• Financial services. A bank monitors transaction paths across on-premises and cloud systems to protect uptime.
• Cloud migration. An enterprise tracks performance across old and new environments during a phased move.
• SaaS operations. A software company uses anomaly detection to catch regressions after each release.
• Cost control. A platform team tiers and filters log data to cut storage spend without losing critical visibility.
How Organizations Can Choose the Right Solution
Start with your most painful incidents and your most complex environments. Then evaluate vendors on:
1. Coverage across on-premises, cloud, hybrid, containers, and legacy systems
2. Telemetry depth across metrics, logs, and traces, and how well they correlate
3. Ease of deployment and time to value
4. AI and automation that reduces noise and speeds root cause analysis
5. Openness, including OpenTelemetry support and integrations with ITSM and CI/CD tools
6. Scalability and performance at your data volumes
7. Cost transparency and controls for managing telemetry growth
8. Security and compliance capabilities
9. Vendor viability, including roadmap, customer base, and support
A proof of concept built around your real incidents will tell you more than any feature list. QKS Group's SPARK Matrix™ ranks and positions leading vendors with global impact, giving buyers an independent shortlisting reference and vendors a benchmark for strategy.
Future Outlook: 2026–2029
• Wider use of generative AI to summarize incidents and suggest likely causes
• OpenTelemetry becoming a default expectation
• Greater focus on telemetry cost control and data tiering
• Continued consolidation of monitoring, logging, tracing, and security tooling
• Stronger links between infrastructure health and business outcomes
Vendors that combine unified visibility, practical AI, and predictable costs are likely to stand out.
Conclusion
Infrastructure Monitoring & Observability Platforms are now foundational to digital resilience. The right choice reduces downtime, controls operating costs, and gives engineering teams the confidence to ship faster. The wrong one adds complexity and dashboards nobody trusts. QKS Group's SPARK Matrix™ research offers a vendor-neutral view of the market to help buyers shortlist with confidence and vendors sharpen their strategy.
1. What is an Infrastructure Monitoring and Observability Platform?
It is a software solution that provides real-time visibility, performance tracking, and deep diagnostic insights across an organization's IT infrastructure, spanning on-premises, cloud, and hybrid environments.
2. What modules do these platforms typically include?
They typically include metrics collection, log management, distributed tracing, alerting, anomaly detection, and dashboard visualization.
3. How do these platforms reduce downtime?
They enable organizations to proactively detect and resolve incidents, minimize downtime, and optimize resource utilization through end-to-end observability.
4. Are these platforms only for large enterprises?
No. According to QKS Group, they serve organizations of all sizes.

 English
 Arabic
 French
 Spanish
 Portuguese
 Deutsch
 Turkish
 Dutch
Dutch
 Italiano
 Romaian
 Portuguese (Brazil)
 Greek
Greek